Casos de uso
Every tree on your farm is different. So why does your harvest forecast still rely on an average tree?
Ask how a harvest forecast is put together on most large almond or pistachio farms, and the answer is usually the same: take the number of trees in the register, assume an average yield per tree and multiply. It’s quick, it’s familiar, and it’s been done that way for years. The problem is that a lot depends on that figure. It’s what decides how many people are hired, how the harvest is organised and how much is promised to buyers, and it rests on an idea that doesn’t hold up in the field.
The average tree doesn’t exist.
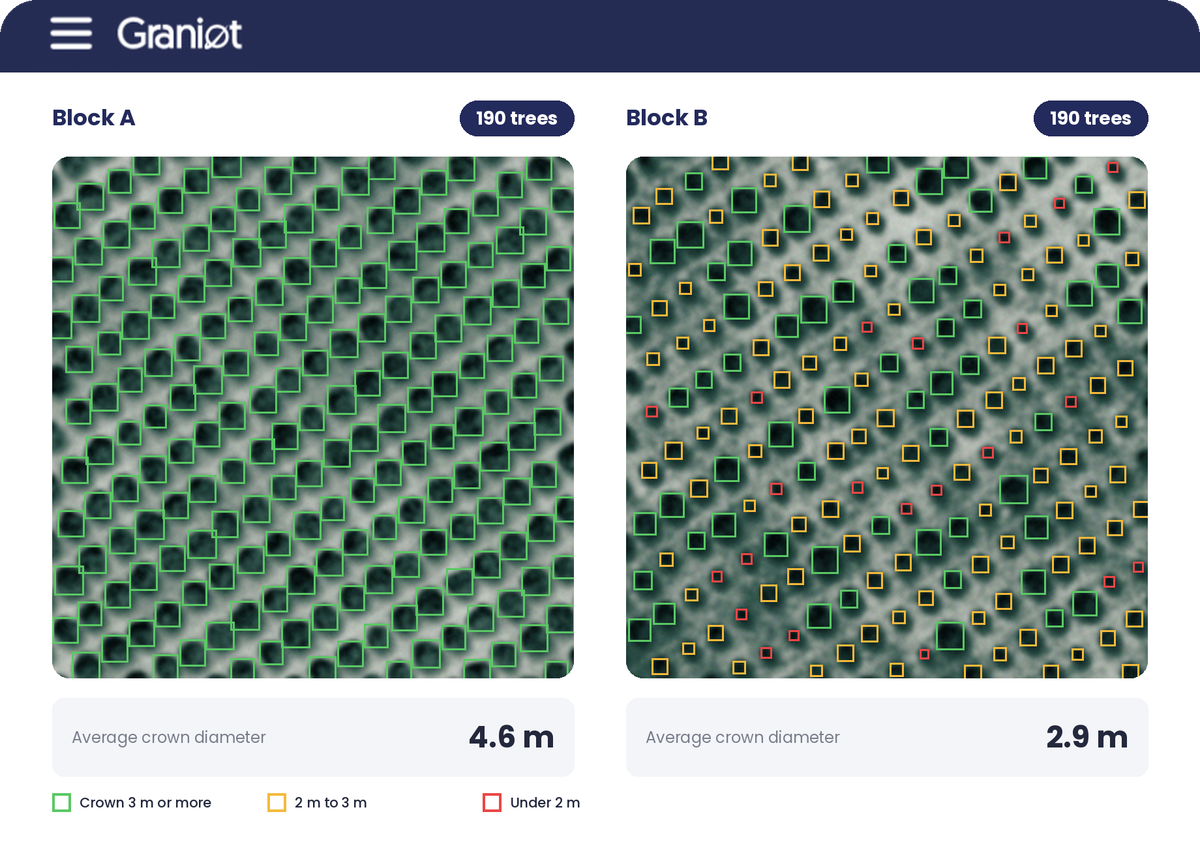
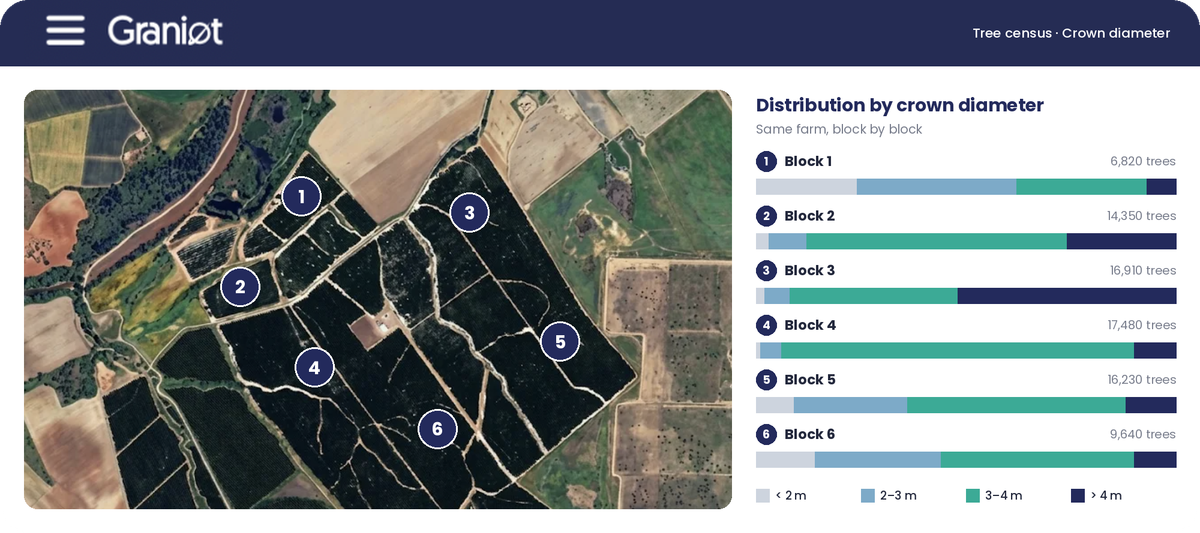
On any large permanent-crop farm, young trees grow next to trees in full production. Some blocks were replanted a few years ago, others have been struggling with water or disease for longer, and the difference between them isn’t always visible from the farm road. Two blocks can have exactly the same number of trees on paper and still have a very different harvest potential, simply because their crowns are at very different stages.
How different? When researchers in Córdoba mapped every tree on an almond farm, the share of ground covered by each tree’s crown ranged from about 30% to almost 70%. Planning with the average tree, they found, overestimates the potential harvest1.
A forecast built on an outdated count or on an average tree can miss in either direction, and both have a cost. If it’s too high, people are hired and logistics are booked for a crop that won’t come in. If it’s too low, volume goes unsold or the harvest has to be reorganised at the last minute.
The difficult part is that it usually only shows once the harvest is in, when it’s too late to adjust. Checking every block on foot beforehand would solve it, but on a farm of hundreds of hectares that simply isn’t realistic.
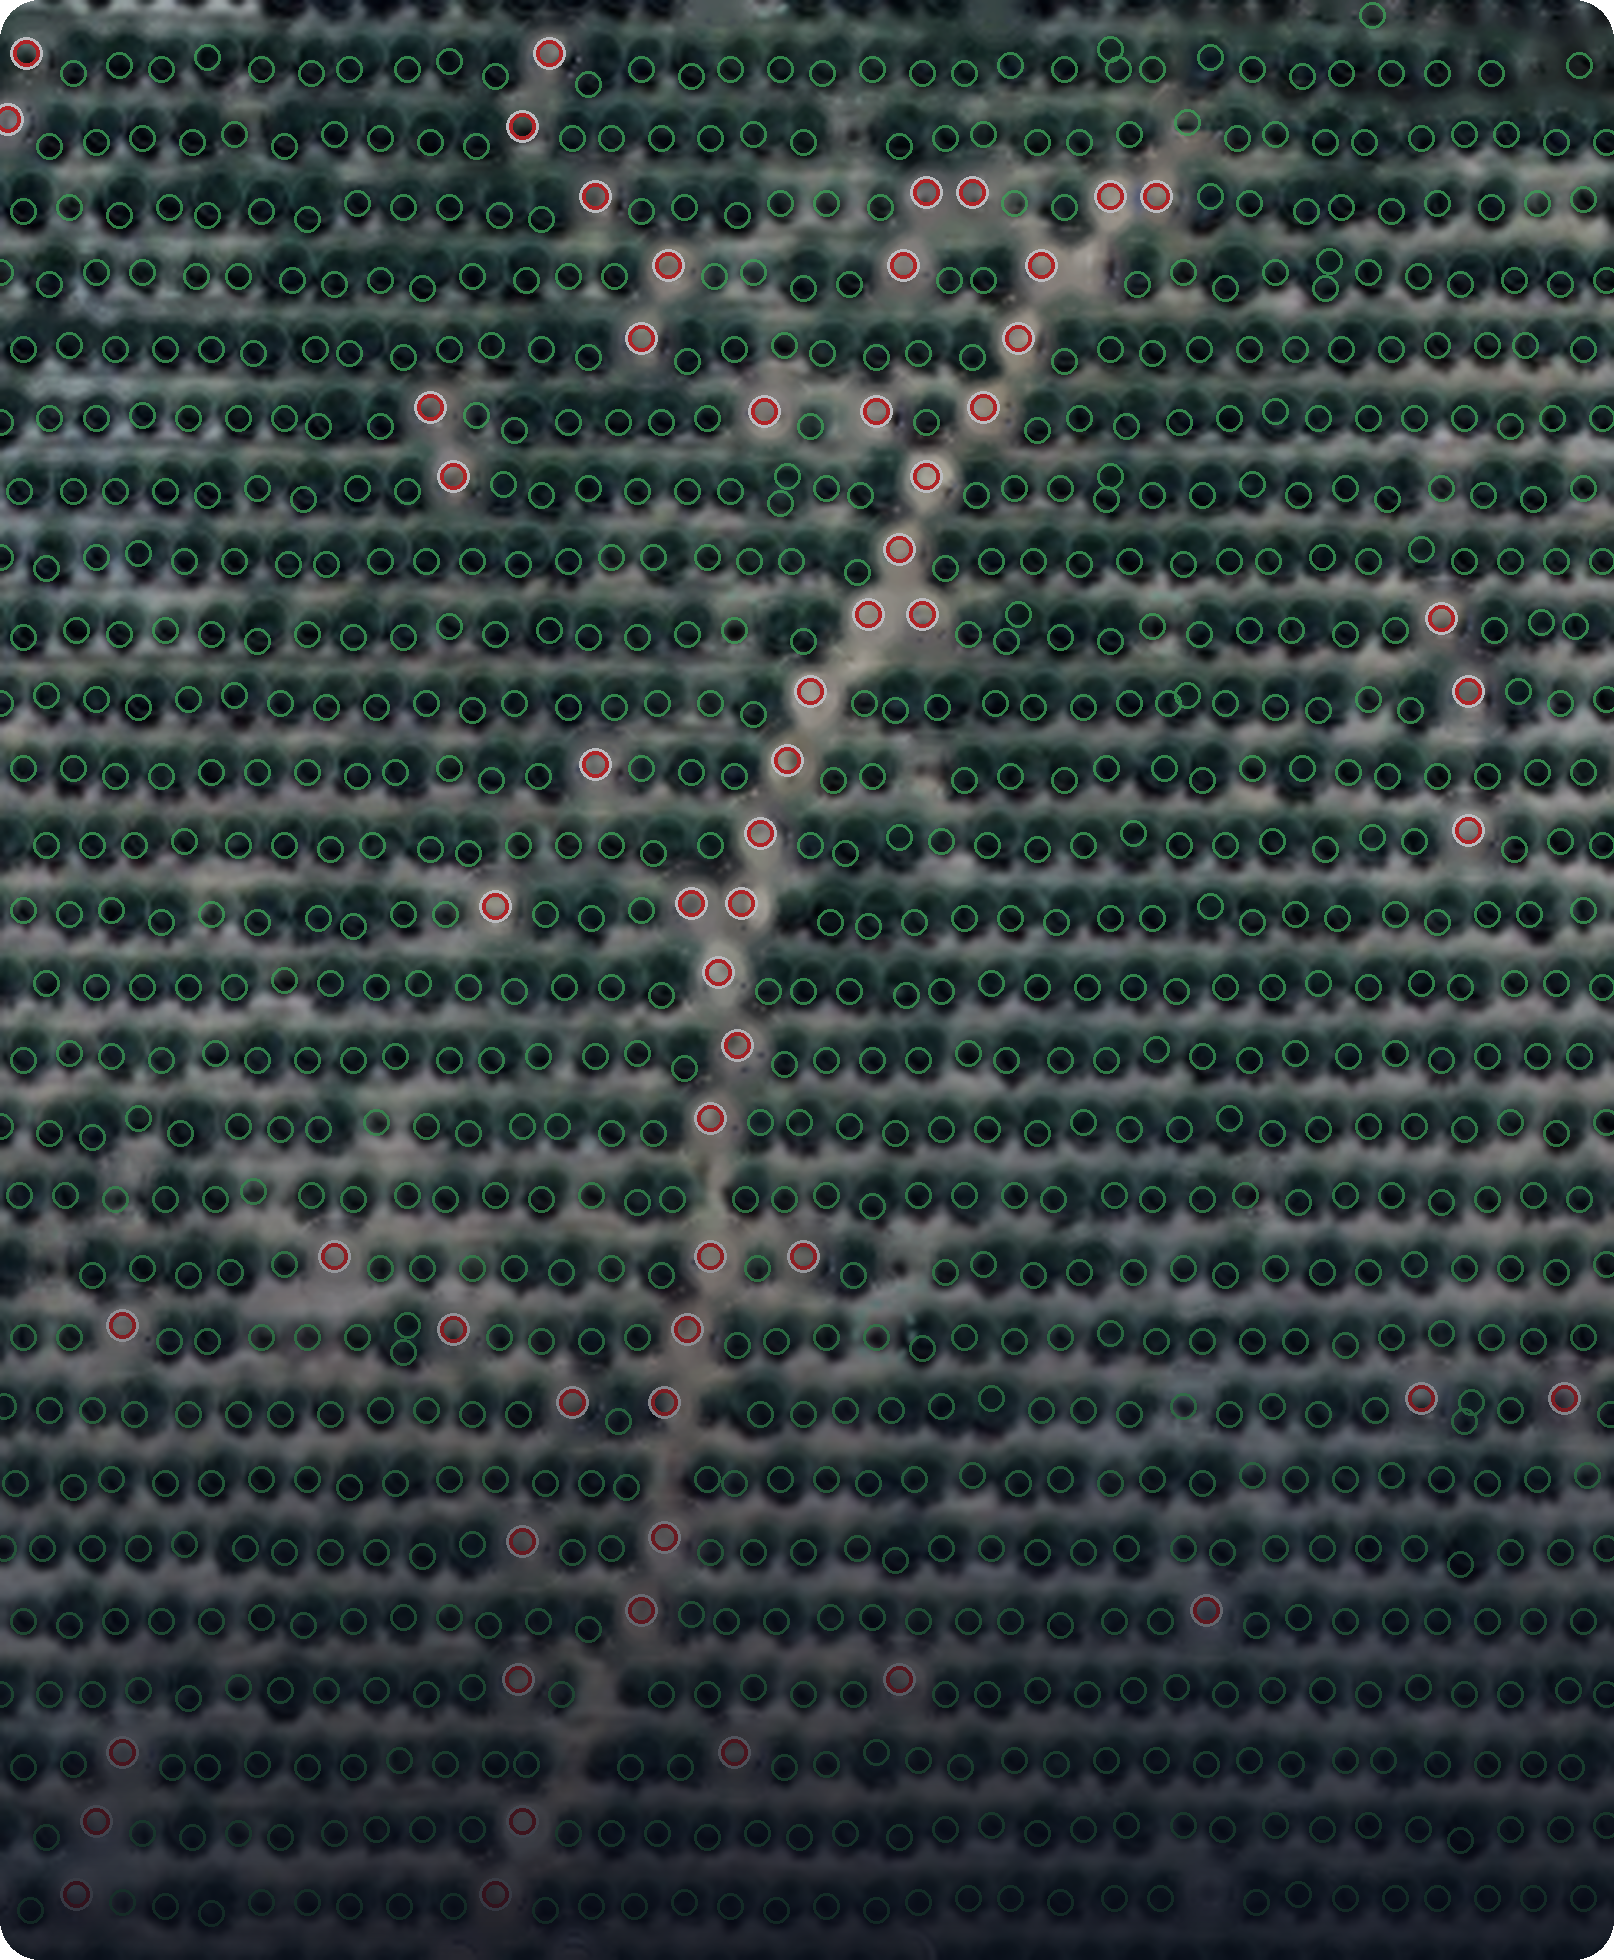
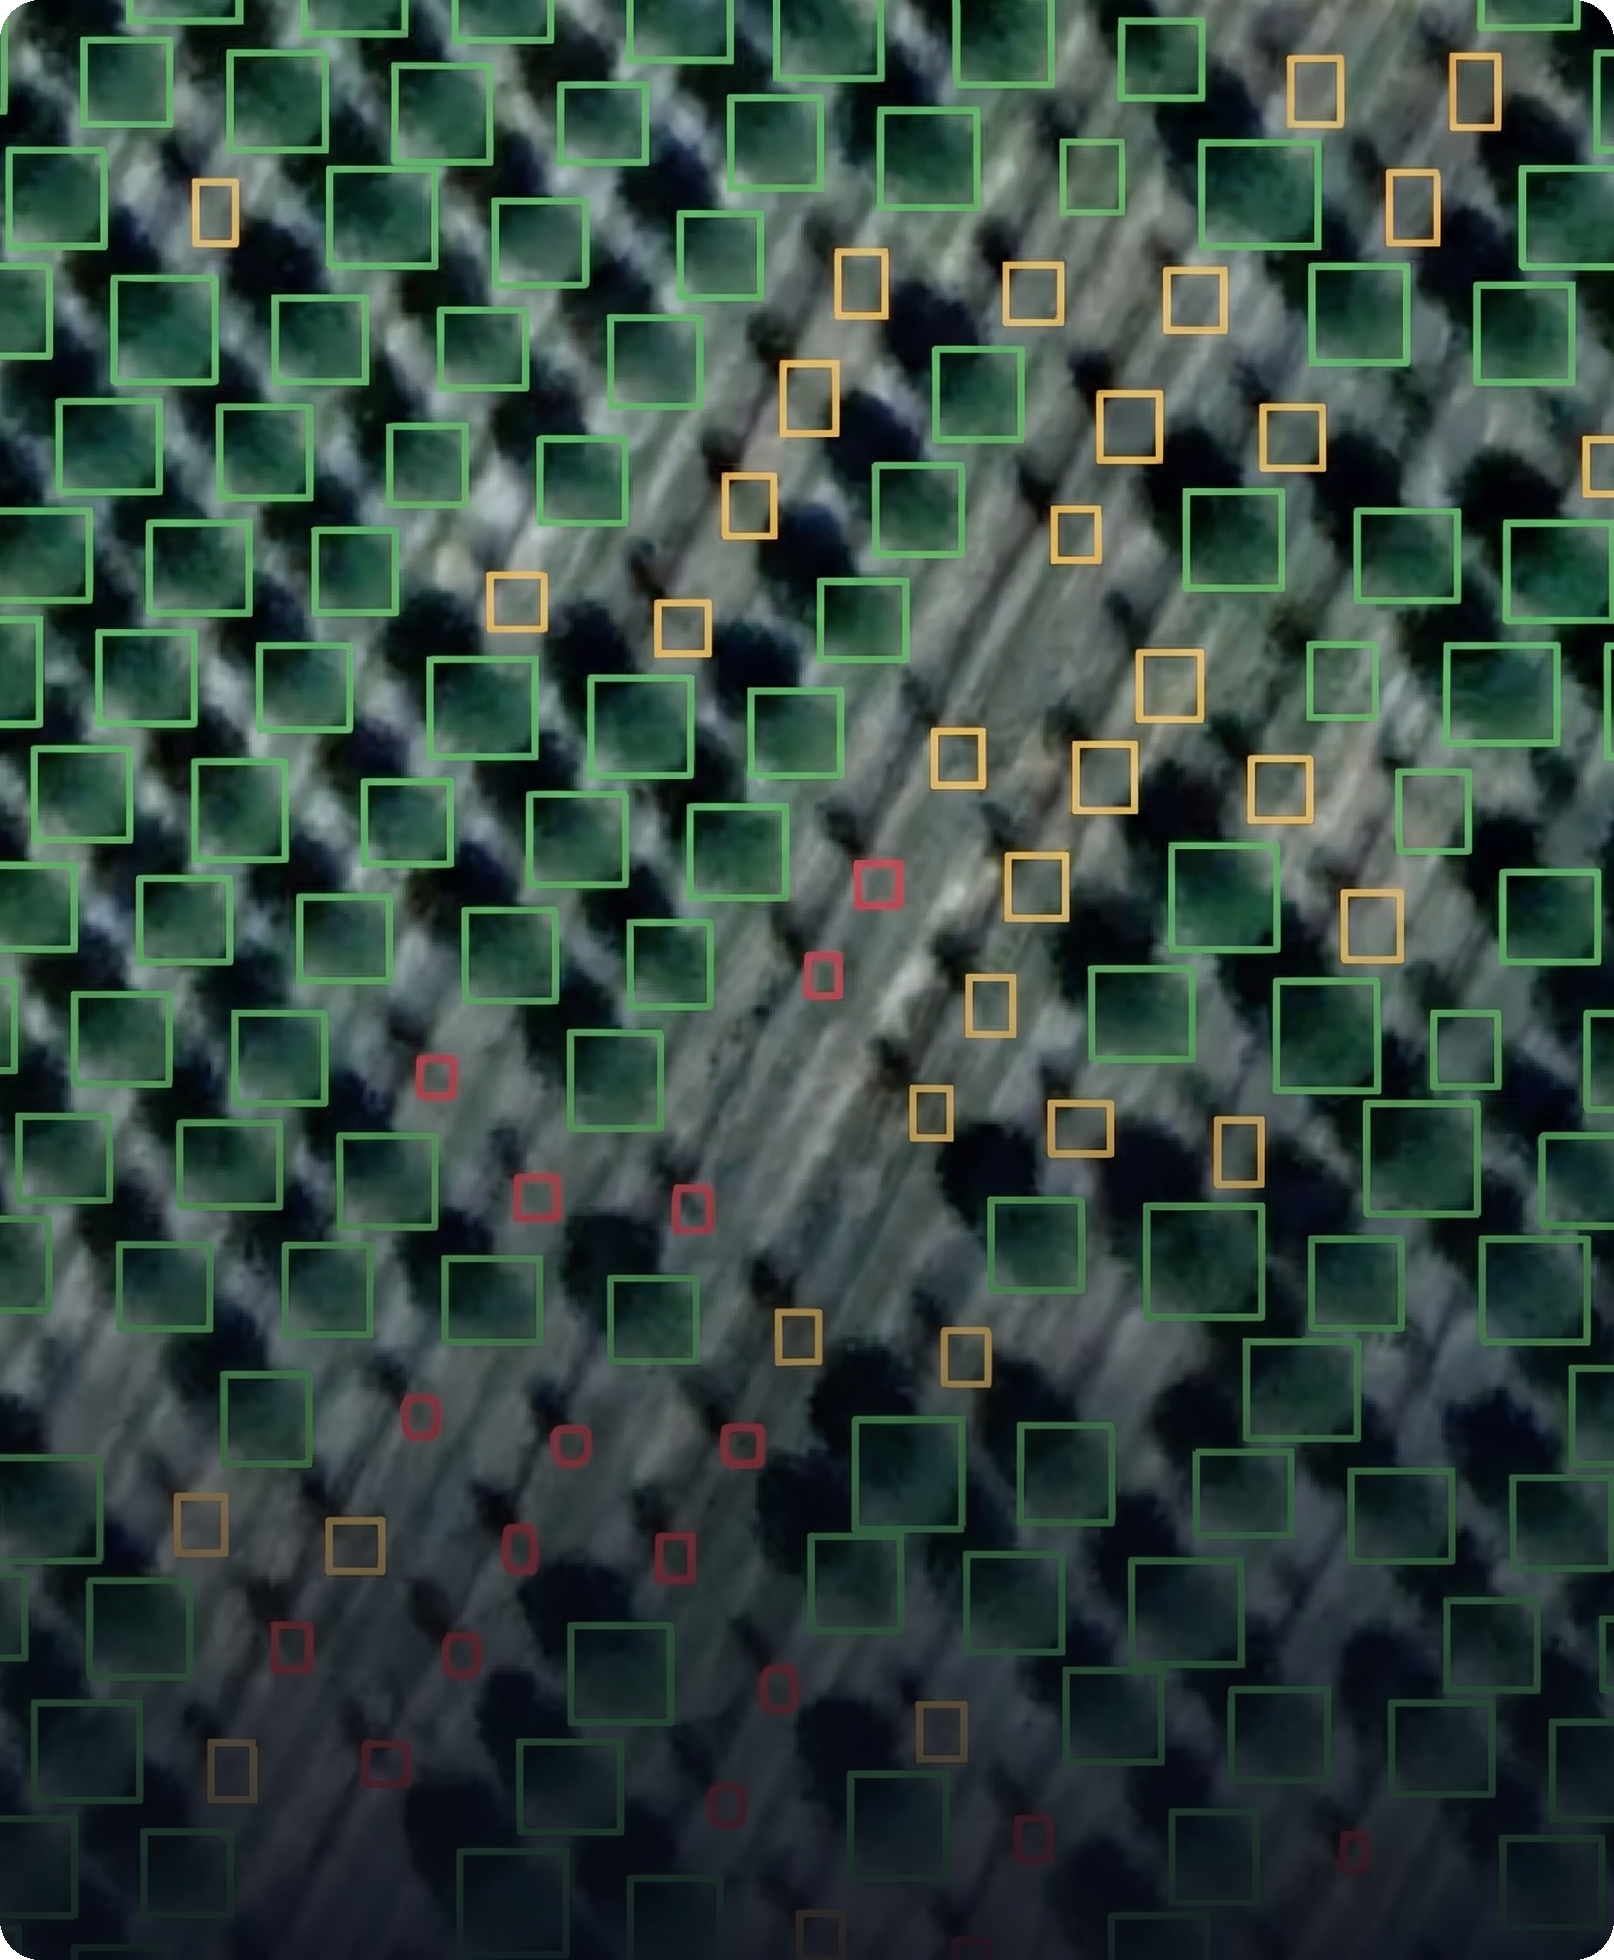
A more reliable forecast starts with knowing what’s really in each block. Using satellite imagery at up to 30 cm resolution, our AI models detect every tree on the farm and measure the diameter of its crown, so you get an inventory block by block of how many trees there are and how developed they are.
Your agronomist can then use that inventory as the starting point for the forecast, together with the field observations and yield records you already have.
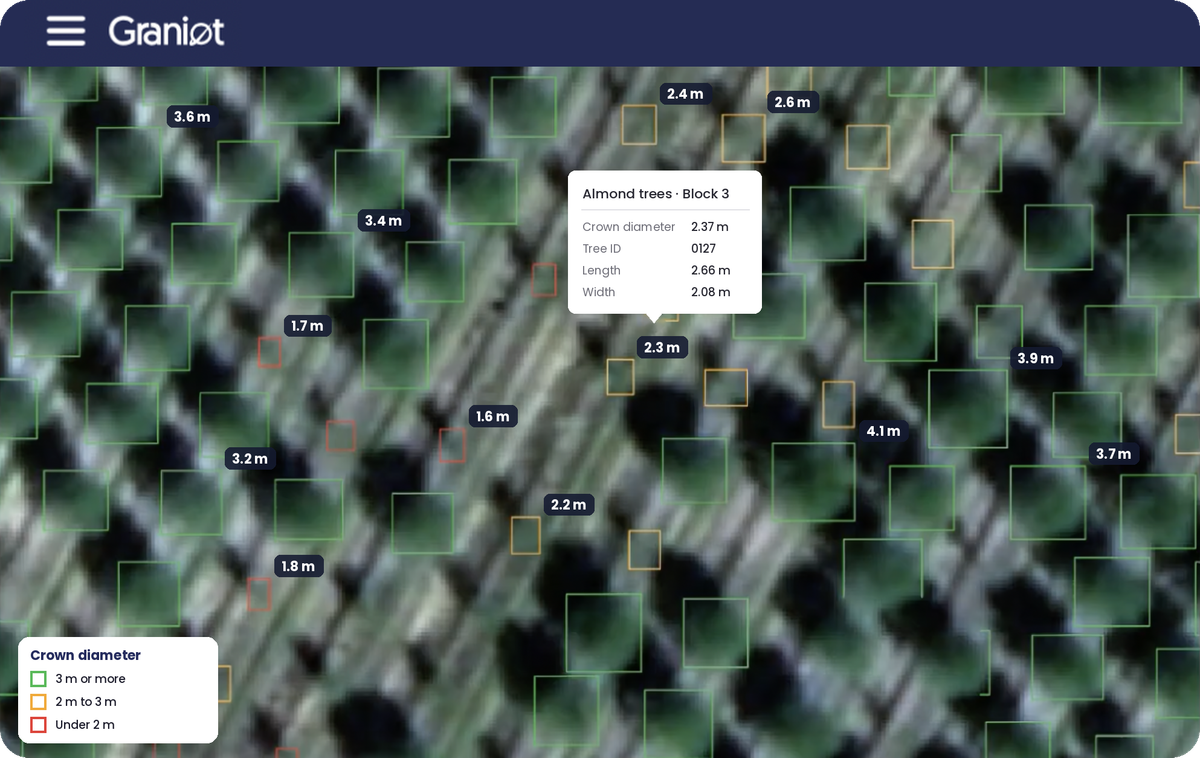
With that information, the forecast no longer has to rely on one figure for the whole farm. It can be built from the real trees in each block, giving more weight to blocks full of developed trees and less to those that are still growing. Your harvest team plans with better information, and your sales team can commit volumes with more confidence.
How much more accurate the forecast becomes will depend on how you combine the inventory with your own data. It’s worth measuring season by season, comparing what you forecast with what you actually harvest.
Crown size is more than a visual detail. Studies on almond farms show that the amount of light a tree’s crown captures is the biggest factor in how much it can produce2. In California, every 1% more light captured by the canopy was linked to about 58 lb of kernels more per acre, roughly 65 kg per hectare, and a ten-year study of almond farms in the same region also identified canopy light interception as a key driver of yield3.
That said, there are clear limits. Crown size shows how much a tree could produce, not exactly how much it will. The real harvest also depends on variety, weather and how the farm is managed, and the relationship has to be calibrated for each variety and farm2. Crown data works best as a starting point, alongside your own field and harvest data.
A satellite inventory doesn’t replace your agronomist’s judgement, but it does give them a more reliable number to start from.
One way to see the difference is to start with what you already have. Bring your last forecast to our Satellite AI Assessment, a two-hour session where we sit down with your team, go through the figures behind it and look at which blocks a satellite inventory could change. By the end, you’ll know whether it’s worth applying to your next forecast and how to track the result.
If you’d like to know more, fill in the form below and we’ll get in touch.
Lorem ipsum dolor sit amet, consectetur adipiscing elit. Vivamus vehicula felis quis ex laoreet sagittis. Praesent non libero vel felis aliquam vestibulum. Donec eu scelerisque.